
How Dynamic Complexity Disrupts Business Operations
Dynamic complexity always produces a negative effect in the form of loss, time elongation or shortage—causing inefficiencies and side effects, which are similar to friction, collision or drag. Dynamic complexity cannot be observed directly, only its effects can be measured. Additionally, dynamic complexity is impossible to predict from historic data—no matter the amount—because the number of states tend to be too large for any given set of samples. Therefore, trend analysis alone cannot sufficiently represent all possible and yet to be discovered system dynamics.
In the early stages, dynamic complexity is like a hidden cancer. Finding a single cancer cell in the human body is like looking for a specific grain of sand in a sandbox. And like cancer, often the disease will only be discovered once unexplained symptoms appear. To proactively treat dynamic complexity before it negatively impacts operations, we need diagnostics that can reliably reveal its future impact. System modeling and mathematical emulation allow us to provoke the existence of dynamic complexity through two hidden exerted system properties: the degree of interdependencies among system components and the multiple perturbations exerted by internal and external influences on both components and the edges connecting them directly or indirectly.
Successful risk determination and mitigation is dependent on how well we understand and account for dynamic complexity, its evolution, and the amount of time before the system will hit the singularity (singularities) through the intensification of stress on the dependencies and intertwined structures forming the system.
Knowing what conditions will cause singularities allows us to understand how the system can be stressed to the point at which it will no longer meet business objectives, and proactively put the risk management practices into place to avoid these unwanted situations.
Below we provide an example of a client case where dynamic complexity played a key role in terms of resource consumption, time to deliver, and volume to deliver. The scenario presented in the graph represents a trading and settlement implementation used by a volume of business that continuously increases. The reaction of the system is shown by the curves.
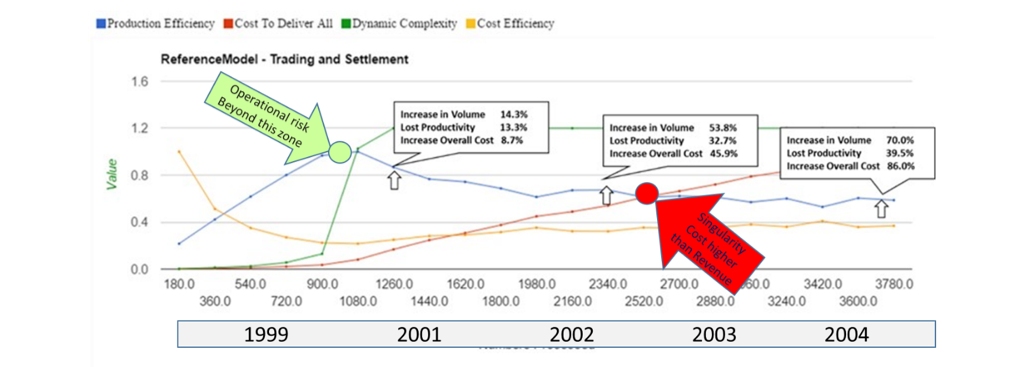
In the graph above, the production efficiency increases until it hits a plateau after which the business is increasingly impacted by a slowdown in productivity and increase in costs. The amount of loss is proportional to the increase in dynamic complexity, which gradually absorbs the resources (i.e. the cost) to deliver little. The singularity occurs when the two curves (productivity/revenue and cost) join, which in turn translates into loss in margin, over costing and overall instability.
In client cases such as this one, we have successfully used predictive emulation to isolate the evolving impact of dynamic complexity and calculate risk as an impact on system performance, cost, scalability and dependability. This allows us to measure changes in system health, when provoked by a change in dynamic complexity’s behavior under different process operational dynamics and identify the component(s) that cause the problem.
But knowing the how and what isn’t sufficient. We also need to know when, so we measure dynamic complexity itself, which then allows us to monitor its evolution and apply the right mitigation strategy at the right time.


